


What is ERA in baseball? St. Louis Cardinals’ Hall Of Fame pitcher, Dizzy Dean, once said “I hate statistics…What I got to know, I keep in my head.” Fast forward nearly a century since Dizzy dazzled on the bump and it’s hard to imagine many pitchers maintaining that kind of thinking. Our current big league hurlers get reports delivered to their lockers, attend performance evaluations and have access to a bevy of statistics on the internet. For many years now, earned run average (ERA) has been one of the most commonly used stats that fans and media have used to evaluate pitcher performance. Now let’s take some time to dive in and understand ERA better!
.jpg)
Major League Baseball defines ERA (or Earned Run Average) as the “number of earned runs a pitcher allows per nine innings” without the assistance of an error from the pitcher’s defense. And if you love a good math equation, we’ll spell out the formula for finding a pitcher’s ERA.
ERA = (Earned Runs / Innings Pitched) * 9
You now know some nuts and bolts of the stat, but how did ERA get its start?
Who Invented Earned Run Average?
If you’re a baseball fan, you’ll be delighted to know that there is a little bit of controversy regarding who invented ERA. Many sources out there on the internet will tell you that the “Father Of Baseball”, Henry Chadwick, invented the statistic during the 19th century. If Henry Chadwick did invent it, he probably didn’t champion widespread use of ERA to evaluate pitcher performance. It seems that it wasn’t until the early 20th century that ERA was widely adopted by player evaluators and fans. The Society for American Baseball Research actually says that around 1910, John Heydler realized how a pitcher’s Win/Loss record could be misleading and “devised a better measure” to evaluate pitcher performance. Heydler’s “better measure” was Earned Run Average.
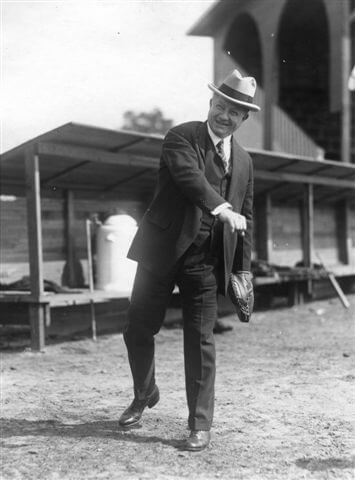 (John Heydler Pictured Here Playing With A Catcher’s Mitt)
It must be said that if John Heydler did invent ERA, then statisticians have combed through the record books to calculate ERA for pitchers who competed in games recorded during the 19th century. An astute fan would notice that Baseball Reference has ERA calculated for pitchers going back as far as 1871.
What Is A Good ERA For A Pitcher?
Unlike the origin of ERA, understanding what is and what is not an excellent ERA figure is well known. Fangraphs, one of the highly-visited hubs for stat seekers, reports that an excellent Earned Run Average number for a pitcher is anything under 2.50. In other words, if a pitcher were to give up an average of 2.5 runs for every 9 innings they threw, they could be said to have an excellent ERA.
To give you a recent example, the Milwaukee Brewers’ Corbin Burnes pitched 167 innings during the 2021 Major League Baseball season. During that body of work, he gave up an average of 2.43 runs per every 9 innings. The consensus would be that Mr. Burnes had an excellent 2021 campaign regarding his earned run average en route to winning the NL Cy Young award.
 (The Milwaukee Brewers’ Corbin Burnes Pitching With His Rawlings Glove)
Is Earned Run Average A Good Statistic?
If you are looking back on a season and simply want to know how many “earned runs” were let in while a given pitcher was on the mound, ERA could be considered a “good” statistic.
But while a pitcher won’t typically luck into an excellent ERA, the statistic is not the most accurate at indicating how well a pitcher prevented runs from being scored. A big reason for its inaccuracy is that ERA leaves a pitcher at the mercy of the scorekeeper (when they determine what is and what isn’t an error) and the quality of the defenders backing him up (high quality fielders could lower his ERA while bad glovesmen could raise it).
>>Heart of the Hide vs Pro Preferred. What's The Difference? <<
When determining how many runs over a 9 inning period are accountable to a pitcher, our friends over at Fangraphs, will let us know that it is best to completely remove the effects of defense and focus on the 3 outcomes that pitchers control most: (1) strikeouts, (2) walks (3) homeruns. By focusing on these 3 “true” outcomes, the statistic FIP (or Fielding Independent Pitching) does one of the better jobs at reporting how a pitcher’s ERA would have appeared if he received league average results on balls that players put into play that didn’t go for homeruns.
We’ll spare you the calculation for finding FIP, but one would read a pitcher’s FIP similarly to how they would read a pitcher's ERA rating. However, 3.20 is considered to be an excellent FIP rating (if you remember, 2.50 was an excellent ERA rating).
Using Burnes’s final 2021 ledger as an example again, we’d find that he registered 1.63 FIP last year. To give that number a dash of hyperbole, the reader should understand that no qualifying pitcher had yet to turn in a single-season FIP lower than that mark in the 21st century! The last pitcher to close a season with a lower FIP than Burnes was Pedro Martinez when he finished the 1999 season with a 1.39 Fielding Independent Pitching rating.
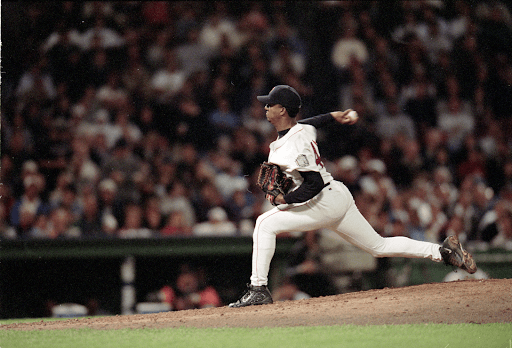 (Pedro Martinez Pitches During The 1999 Season)
--
Now that you know a little more about statistically evaluating pitchers, you’ll be prepped to assess your performance the next time you step on the mound with your favorite glove. And if you haven’t picked up a new glove in a while, JustGloves has the largest selection of baseball gloves available online with free, fast shipping on all orders. If you need help selecting a glove or mitt you can give us a call at 866-321-4568, email us at experts@justgloves.com, or you can click here to live chat. Don't forget, we are here for you from Click To Catch!
